Determinants of Supply and Demand of A Stock: Example of Garanti Bank’s Stock
Supply and demand are the main drivers of the markets. Analysis of them provides us to forecast trends in competitive markets for goods and services, including changes in the prices of our products, substitutes and complements, and inputs (Baye). Besides this, supply and demand depends on some factors other than price that determine the levels of supply and demand. These determinants differs for supply and demand. While determinants of demand are income levels, prices of related goods, advertising and consumer tastes, population, and consumer expectations, determinants of supply are input prices, number of firms, substitutes, taxes, technology and government regulations, and producer expectations (Baye). Although these determinants are generally applicable for most of markets, few markets have different supply and demand determinants. One of these markets is stock exchange market which is one of the most competitive markets in the world. Since stock prices change in every moment of trading session during a day, it presents us that supply and demand for stocks are very sensitive to their determinants, but what are these determinants, and how can they affect the stock prices?
In order to analyse supply and demand determinants in the stock exchange market, we will use the stock of Garanti Bank (GARAN) in Istanbul Stock Exchange as an example. Before analysing the effects of them, let’s briefly illustrate these determinants which affect a stock’s price through the positive and negative news flows of them. In his article, Marco den Ouden classifies the determinants seperately for demand and supply sides. For demand side, they are company’s profits, new sales contracts, debt, news about the company, and mass psychology about the company. For supply side, they are new share offering, employee stock options, stock split, and stock buyback. All these determinants are based on the company, but we know that a company’s stock price also depends on external factors such as news about the industry, interest rates, domestic economy, governmental regulations, and global economy. These factors, whether they are related to internal or external environment, can affect the stock price daily, weekly or for a longer time. In our study, we will examine their possible effects on GARAN stock for just one day.
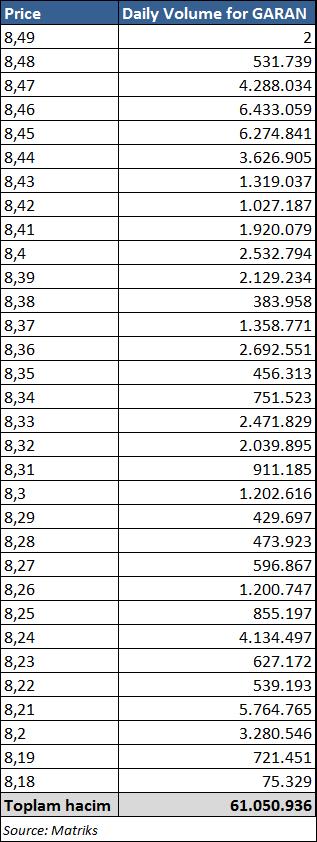
In our analysis of supply and demand determinants for GARAN stock, we will just illustrate the effects of some determinants as earnings announcements, interest rates, and economic data. In order to interpret the effects, we will use data of GARAN stock as of November 1, 2016. In November 1, GARAN stock’s closing price was 8.24 TRY and total volume was 61.05 million shares, excluding the private orders during the date. In addition, we know that during a trading session, equilibrium price for the buyers and sellers of stock changes every moment. All price levels and their corresponding volume levels are represented in Table-1. Note that these data cover the time between 9:30 and 17:40 in November 1.
Table-1: GARAN Stock’s Price Levels And Daily Volume Shares for November 1
According to the table, the highest price is 8.49 TRY and the lowest price is 8.18 TRY. The prices between these two levels indicate the willingness to pay of buyers and willingness to sell of sellers in the trading session like an auction. In each price level, there is an equilibrium, but these equilibrium levels are affected by the news flows during the trading day. At the end of the trading session, the closing price, 8.24 TRY for GARAN stock, is the last equilibrium price for the day. Also, the total cumulative volume, 61.05 million shares for GARAN stock, shows the equilibrium quantity of shares for the day. In the light of these numbers, we can draw the demand and supply curves for GARAN stock for the end of the day as in Figure 1.
Figure-1: Supply and Demand Curves for GARAN Stock for Trading Day of November 1, 2016
Now let’s review the effects of the determinants of supply and demand that we have chosen on the supply and demand curves. (Note that we will assume that if the determinants were announced in the trading day of November 1, what the closing equilibrium price and volume might possibly be. Moreover, for a more detailed analysis, someone can describe the equilibrium price and volume by using regression analysis which will include these determinants as independent variables, too.)
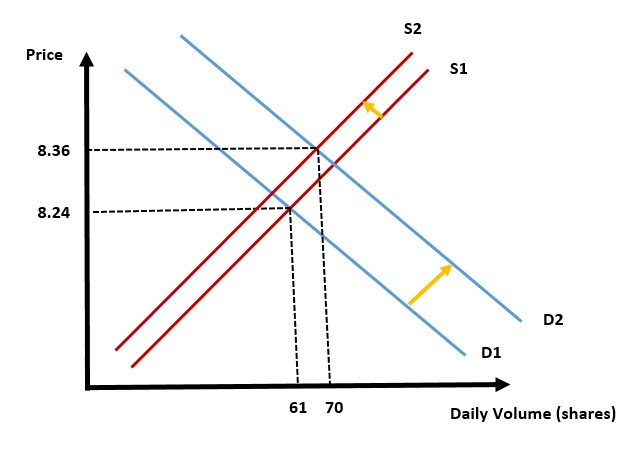
a) Earnings announcements: When a publicly held company posts the earnings for a fiscal period, if the earnings amount is announced higher than the analysts’ estimates, demand for its stock will increase and thus its price because the stock becomes more attractive for the investors in the market. As a result, demand curve will shift to the right . At the same time, some investors will feel that increase in stock’s price satisfies their return expectations, and thus they will sell the stocks that they hold. However, we know that change in supply is lower than the increase in demand. Therefore, supply curve will slightly shift to the left since the most of the stock’s holders will continue to hold the stocks that they have due to the positive expectations about the company. When we apply these shifts to our GARAN stock’s demand and supply curves, equilibrium price will increase as in the Figure 2.
Figure-2: New Supply and Demand Curves as a result of higher earnings results for GARAN Stock
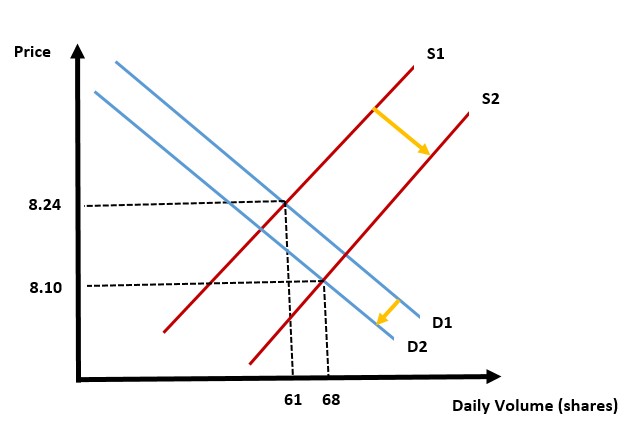
If the earnings amount is announced lower than the analysts’ estimates, we will see the inverse results which are drawn in Figure 2. That is, change in demand will be lower than the increase in supply because only some investors will continue to buy the stock due to the opinion that the stock’s price is cheap now.
Figure-3: New Supply and Demand Curves as a result of lower earnings results for GARAN Stock
 b) Economic Data: When an economic data is announced during the trading session, it gives some clues for the economic growth. Depending on the type of the data, if the data comes better or worse than the analysts’ estimates, stock market gives positive or negative reactions. For example, when Turkey’s economic growth rate is announced higher than forecast, the stock prices in Istanbul Stock Exchange Market will rise. That is, the price and volume of GARAN stock will also rise (See Figure 2). On the other hand, if the data comes lower than estimates, we will see the inverse effects on GARAN stock (See Figure 3).
c) Interest Rates: Changes in the interest rates affect stocks positively or negatively. If interest rates increase in Turkey, some investors will prefer time-depozits or treasury bills instead of stock. As a result, demand for stocks will decrease, leading to decreases in the equilibrium price and volume of GARAN stock (See Figure 3). In addition, for example, possible interest rate changes in U.S will also affect the Turkish stocks negatively since some foreign investors will prefer to invest to U.S stocks, and thus they will sell Turkish stocks, leading to decrease in GARAN stock’s price. On the other hand, if the interest rates decrease, many investors will prefer stocks to make investments. Therefore, this will lead to increases in the equilibrium price and volume of GARAN stock (See Figure 2).
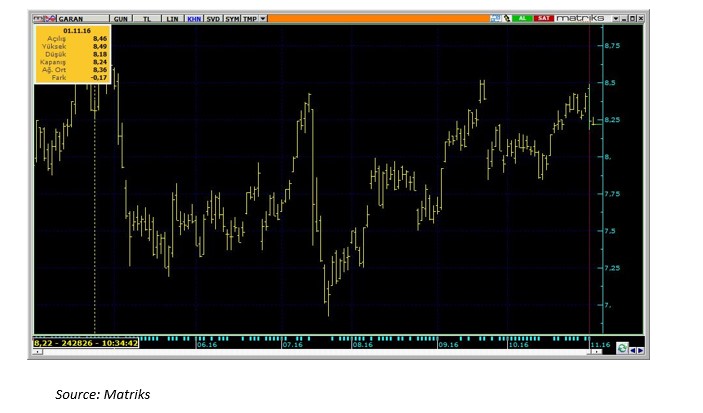
The determinants that we have just discussed above and some others affect the stock prices in each day. Thus a stock has different equilibrium prices in each moment of the trading day and other trading days. You can see the these fluctuations in the equilibrium prices for GARAN stock in the following picture.
Figure-4: Daily price fluctuations graph of GARAN Stock
Considering above points, we can say that classic determinants of supply and demand can show the differences depending on the goods and services markets that we aim to analyse. One of these markets is the stock exchange market. Supply and demand drivers of a stock such as earnings reports, economic data and interest rates are different than the supply and demand drivers of a normal good or service such as income, price of substitutes, technology and input prices, etc. But it can clearly be stated that the movements in the supply and demand curves have the same logic for all markets even the reasons of movements are different.
References
Books
Baye, Michael R. & Prince Jeffrey T., 2014. Managerial economics and business strategy. 8th edition. New York: McGraw-Hill
Other Publications
Den Ouden, M., 2004. Supply and Demand and the Stock Market. http://breakoutreport.com/articles/economics/supplydemand.htm . [accessed 1 November 2016)
Evans, G., 2012. Chapter 3 – A Supply and Demand Model for Stocks. http://pages.hmc.edu/evans/CH3StockSD.pdf . [accessed 1 November 2016)
Wolski, C. http://smallbusiness.chron.com/five-factors-events-affect-stock-market-3384.html . [accessed 1 November 2016)

